
在iOS程序中创建美观的股票图表
SwiftUI 框架在 2019 年的 WWDC 大会引入后,广受 iOS 社区欢迎。这种用 Swift 语言编写,易用的、声明式的 API 让开发者可以快速构建 UI 原型。
虽然我们能用 Shapes 协议从头开始构建 条形图,但是构建折线图就不一样了。幸运的是,我们有 Paths 这个结构体来帮助我们。
使用 SwiftUI 中的 paths,跟 Core Graphics 框架中的 CGPaths 类似,我们可以把直线与曲线结合,来构建美观的标志和形状。
SwiftUI 中的 paths 是一套真正用声明式的方式来构建 UI 的指令集。在下面的几节中,我们将会讨论它的意义。
我们的目标
- 探索 SwiftUI 的 Path API,通过它来创建简单的图形。
- 用 Combine 和 URLSession 来获取历史股票数据。我们将会用 Alpha Vantage 的 API 来取得股票信息。
- 在 SwiftUI 中创建折线图,来展示随时间变化的股票价格。
读完本文后,你应该能够开发与下面类似的 iOS 程序。

创建一个简单的 Swift Path
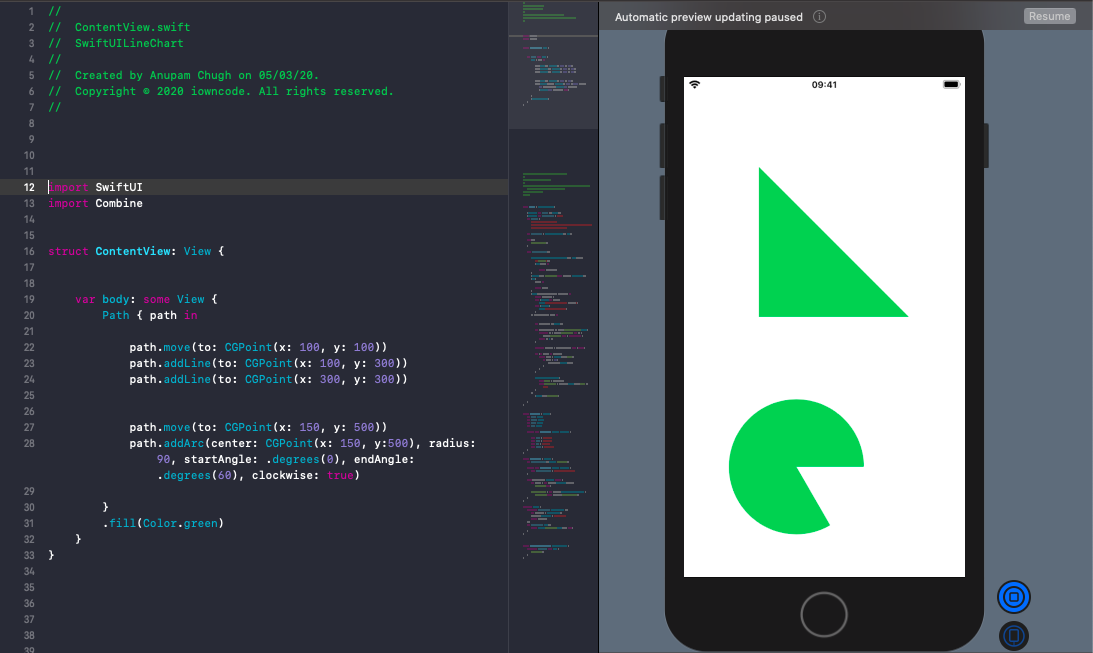
下面的例子,是通过在 SwiftUI 中使用 paths 来创建直角三角形:
1
2
3
4
5
6
7
var body: some View {
	Path { path in
		path.move(to: CGPoint(x: 100, y: 100))
		path.addLine(to: CGPoint(x: 100, y: 300))
		path.addLine(to: CGPoint(x: 300, y: 300))
	}.fill(Color.green)
}
Path API 有很多函数。move 是用来设置路径的起点,addline 是用来向指定目标点绘制一条直线。
另外 addArc、addCurve、addQuadCurve、addRect 和 addEllipse 等方法可以让我们创建圆弧或者贝塞尔曲线。
用 addPath 可以添加两条或者多条路径。
下面的插图展示了一个三角形,这个三角形下面有一个圆饼图。
既然我们已经了解怎样在 SwiftUI 中创建 paths,赶紧来看看 SwiftUI 中的折线图。
SwiftUI 折线图
下面给出的模型,是用来解析 API 响应返回的 JSON。
1
2
3
4
5
6
7
8
9
10
11
12
13
14
15
16
17
18
19
20
21
22
23
24
25
26
27
28
struct StockPrice : Codable{
    let open: String
    let close: String
    let high: String
    let low: String

    private enum CodingKeys: String, CodingKey {

        case open = "1. open"
        case high = "2. high"
        case low = "3. low"
        case close = "4. close"
    }
}

struct StocksDaily : Codable {
    let timeSeriesDaily: [String: StockPrice]?

    private enum CodingKeys: String, CodingKey {
        case timeSeriesDaily = "Time Series (Daily)"
    }

    init(from decoder: Decoder) throws {
        let values = try decoder.container(keyedBy: CodingKeys.self)

        timeSeriesDaily = try (values.decodeIfPresent([String : StockPrice].self, forKey: .timeSeriesDaily))
    }
}
创建一个 ObservableObject 类。我们用 URLSession 中的 Combine Publisher 来处理 API 请求,然后用 Combine 操作来转换结果。
1
2
3
4
5
6
7
8
9
10
11
12
13
14
15
16
17
18
19
20
21
22
23
24
25
26
27
28
29
30
31
32
33
34
35
36
37
38
39
40
41
42
43
44
45
46
47
48
49
50
51
52
53
54
55
56
57
58
59
60
61
class Stocks : ObservableObject {

    @Published var prices = [Double]()
    @Published var currentPrice = "...."
    var urlBase = "https://www.alphavantage.co/query?function=TIME_SERIES_DAILY&symbol=NSE:YESBANK&apikey=demo&datatype=json"

    var cancellable : Set<AnyCancellable> = Set()

    init() {
        fetchStockPrice()
    }

    func fetchStockPrice(){

        URLSession.shared.dataTaskPublisher(for: URL(string: "\(urlBase)")!)
            .map{output in

                return output.data
        }
        .decode(type: StocksDaily.self, decoder: JSONDecoder())
        .sink(receiveCompletion: {_ in
            print("completed")
        }, receiveValue: { value in

            var stockPrices = [Double]()

            let orderedDates =  value.timeSeriesDaily?.sorted{
                guard let d1 = $0.key.stringDate, let d2 = $1.key.stringDate else { return false }
                return d1 < d2
            }

            guard let stockData = orderedDates else {return}

            for (_, stock) in stockData {
                if let stock = Double(stock.close){
                    if stock > 0.0{
                        stockPrices.append(stock)
                    }
                }
            }

            DispatchQueue.main.async{
                self.prices = stockPrices
                self.currentPrice = stockData.last?.value.close ?? "..."
            }
        })
            .store(in: &cancellable)

    }
}

extension String {
    static let shortDate: DateFormatter = {
        let formatter = DateFormatter()
        formatter.dateFormat = "yyyy-MM-dd"
        return formatter
    }()
    var stringDate: Date? {
        return String.shortDate.date(from: self)
    }
}
API 结果中包含用日期作为 key 的内置 JSON。它们在字典中是无序的,需要进行排序。因此,我们声明了一个把字符串转换为日期的扩展,然后在 sort 方法中进行比较。
既然已经在 Published 属性中获得了价格和股票数据,我们需要将它们传递给 LineView — 下面我们将会看到的一个自定义的 SwiftUI 视图:
1
2
3
4
5
6
7
8
9
10
11
12
13
14
15
16
17
18
19
20
21
22
23
24
25
26
27
28
29
30
31
32
33
34
35
36
37
38
39
40
41
42
43
44
45
46
47
struct LineView: View {
    var data: [(Double)]
    var title: String?
    var price: String?

    public init(data: [Double],
                title: String? = nil,
                price: String? = nil) {

        self.data = data
        self.title = title
        self.price = price
    }

    public var body: some View {
        GeometryReader{ geometry in
            VStack(alignment: .leading, spacing: 8) {
                Group{
                    if (self.title != nil){
                        Text(self.title!)
                            .font(.title)
                    }
                    if (self.price != nil){
                        Text(self.price!)
                            .font(.body)
                        .offset(x: 5, y: 0)
                    }
                }.offset(x: 0, y: 0)
                ZStack{
                    GeometryReader{ reader in
                        Line(data: self.data,
                             frame: .constant(CGRect(x: 0, y: 0, width: reader.frame(in: .local).width , height: reader.frame(in: .local).height)),
                             minDataValue: .constant(nil),
                             maxDataValue: .constant(nil)
                        )
                            .offset(x: 0, y: 0)
                    }
                    .frame(width: geometry.frame(in: .local).size.width, height: 200)
                    .offset(x: 0, y: -100)

                }
                .frame(width: geometry.frame(in: .local).size.width, height: 200)

            }
        }
    }
}
上面的视图从 SwiftUI 中的 ContentView 唤起,传入了名称、价格和历史价格的数组。由于使用了 GeometryReader,我们要向 Line 结构中的 frame 传入 reader 的宽和高。我们最后会用 SwiftUI 中的 paths 来连接这些点:
1
2
3
4
5
6
7
8
9
10
11
12
13
14
15
16
17
18
19
20
21
22
23
24
25
26
27
28
29
30
31
32
33
34
35
36
37
38
39
40
41
42
43
44
45
46
47
48
49
struct Line: View {
    var data: [(Double)]
    @Binding var frame: CGRect

    let padding: CGFloat = 30

    var stepWidth: CGFloat {
        if data.count < 2 {
            return 0
        }
        return frame.size.width / CGFloat(data.count-1)
    }
    var stepHeight: CGFloat {
        var min: Double?
        var max: Double?
        let points = self.data
        if let minPoint = points.min(), let maxPoint = points.max(), minPoint != maxPoint {
            min = minPoint
            max = maxPoint
        }else {
            return 0
        }
        if let min = min, let max = max, min != max {
            if (min <= 0){
                return (frame.size.height-padding) / CGFloat(max - min)
            }else{
                return (frame.size.height-padding) / CGFloat(max + min)
            }
        }

        return 0
    }
    var path: Path {
        let points = self.data
        return Path.lineChart(points: points, step: CGPoint(x: stepWidth, y: stepHeight))
    }

    public var body: some View {

        ZStack {

            self.path
                .stroke(Color.green ,style: StrokeStyle(lineWidth: 3, lineJoin: .round))
                .rotationEffect(.degrees(180), anchor: .center)
                .rotation3DEffect(.degrees(180), axis: (x: 0, y: 1, z: 0))
                .drawingGroup()
        }
    }
}
计算 stepWidth 和 stepHeight 的目的是在给定 frame 的宽和高的情况下,对图表进行约束。然后,把它们传递给 Path 结构体的扩展函数,用来创建折线图:
1
2
3
4
5
6
7
8
9
10
11
12
13
14
15
16
17
extension Path {

    static func lineChart(points:[Double], step:CGPoint) -> Path {
        var path = Path()
        if (points.count < 2){
            return path
        }
        guard let offset = points.min() else { return path }
        let p1 = CGPoint(x: 0, y: CGFloat(points[0]-offset)*step.y)
        path.move(to: p1)
        for pointIndex in 1..<points.count {
            let p2 = CGPoint(x: step.x * CGFloat(pointIndex), y: step.y*CGFloat(points[pointIndex]-offset))
            path.addLine(to: p2)
        }
        return path
    }
}
最后,展示股票折线图的 SwiftUI 程序就完成了,如下图所示:

总结
本文中,我们再次将 SwiftUI 和 Combine 成功结合 — 这次是抓取股票价格数据,然后在折线图中展示。通过了解 SwiftUI 中 paths 的各种用法,并使用 path 方法来构建各种复杂的图形,是一个了解并入门 SwiftUI 的好机会。
你可以使用手势对点和相应的值进行高亮处理,来进一步了解上文中的 SwiftUI 折线图。文章结束了。感谢阅读。